|
| | |
|

|
A Chart, also called a graph, is a graphical representation of data, in which the data is represented by symbols, such as bars in a bar chart, lines in a line chart, or slices in a pie chart.
Value - It has no value.
|
| Properties - General |
GENERAL
Name – Name of the Control
This Name will be used
to identify the Control throughout the Project. The name of the Control can only contain letters, digits or underscore (_).
Title – Title of the Control. The position may vary according to the Operating System.
If you click on  at the right side of this property, you’ll be able to set its value in each Language of the Project. at the right side of this property, you’ll be able to set its value in each Language of the Project.
Description – Description of the Control
This Description is for
your information only, Kalipso does nothing with it. If you click on  at the side of this property, you’ll be able to set the value in each Language of the Project. at the side of this property, you’ll be able to set the value in each Language of the Project.
Plane – Plane of the Form where the Control should be created
Check the Planes chapter for more information.
Width – Width of the Control
You can set this value is runtime via the “Set Property” Action. You can
retrieve this value in runtime via the “Get Property” Action. If you
click on  at the side of this property, you’ll be able to set the value of it in both Portrait and Landscape orientation (see the Project Properties). at the side of this property, you’ll be able to set the value of it in both Portrait and Landscape orientation (see the Project Properties).
Height – Height of the Control
You can set this value is runtime via the “Set Property” Action. You can
retrieve this value in runtime via the “Get Property” Action. If you
click on at the side of this property, you’ll be able to set the value of it in both Portrait and Landscape orientation (see the Project Properties).
From Left – X position of the Control
You can set this value is runtime via the “Set Property” Action. You can retrieve this value in runtime via the “Get Property” Action. If you click on at the side of this property, you’ll be able to set the value of it in both Portrait and Landscape orientation (see the Project Properties).
From Top – Y position of the Control
You can set this value is runtime via the “Set Property” Action. You can retrieve this value in runtime via the “Get Property” Action. If you click on at the side of this property, you’ll be able to set the value of it in both Portrait and Landscape orientation (see the Project Properties).
STYLE
Font – Font of the displayed Text
Size – Font size of the displayed Text
Properties – Font properties of the displayed Text
Font Color – Font color of the displayed Text
You can set this value
is runtime via the “Set Property” Action. You can retrieve this value in
runtime via the “Get Property” Action.
Backg. Color – Background color of the Control
You can set this value
is runtime via the “Set Property” Action. You can retrieve this value in
runtime via the “Get Property” Action.
Scale Font Size – Font size of the Chart's Font
Scale Step – Value of the intervals used in the Chart's scale
Leave empty for an automatic value, calculated in runtime and according to data.
Scale Lines – When active, the lines of the chart's scale are displayed.
Embed page 'style_Border' not found.
|
|
| Properties - Content |
Chart Type
Pie - A circle is divided into sectors that each represent a proportion of the whole.
Line - Displays information as a series of data points called 'markers', connected by straight line segments
Bar - Presents grouped data with rectangular bars with lengths proportional to the values that they represent
Multi Line - Line chart in which multiple data sets are represented by drawing the lines overlapped
Multi Bar - Bar chart in which multiple data sets are represented by drawing the bars side by side in a cluster
Data Source
Database Table - The control
will be linked to a Database Table and the number of records will be the
same as the source Database Table. For the data to be displayed,
"Refresh Control" Action must be called.
Kalipso Syntax - A slightly different form of SQL.
Everything remains the same but instead of single-quotes to enclosure
string types, you should use double-quotes. When referring to Controls
or Variables, quoting is not needed.
String Expression - A string
expression who will be evaluated and the result is executed over the
database. You are responsible by specifying a result with the syntax
expected by the database. Quoting is also your responsibility.
Filter - "Where" clause to be applied in the "select" to the Database Table.
Order By - "Order By" to be applied in the "select" to the Database Table.
SQL Advanced - You're able to define the query that fills the control. The query should return a column for each link.
Database Profile - Database connection over which the specified query should be executed. You only need to specify one if it's online.
Query - String expression who will be evaluated and the result executed over the database.
Single Series
(Pie, Line, Bar)
|
Multiple Series
(Line, Bar)
|
| |
|
| |
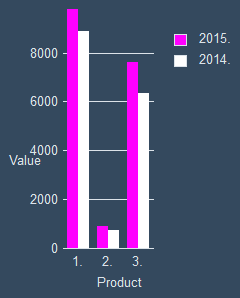
Data Structure
One Column for all Series - Select this option when the data that defines the "series" is contained in the same column.
In the following data structure, "Year" would be the "series" column.
| SalesHistory |
| ProductCode |
| Year |
| SalesValue |
| SalesTargetValue |
|
 |
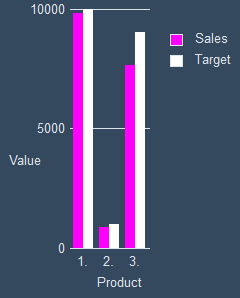
One Column per Series - Select this option if the data that defines the "series" is contained in several columns.
In the following data structure, "SalesValue" and "SalesTargetValue" would be the "series" columns.
SalesHistory
|
| ProductCode |
| SalesValue |
| SalesTargetValue |
|
 |
|
| |
|
Table - Database Table from where the data should be loaded
Subtitle Column - Column from which data should be displayed in the horizontal axis
Value Column - Column from which data should be displayed in the vertical axis
|
Color Column - Column which data represents the color of the sector, line or bar
Automatic - The color is defined automatically by the system
Specify Color - You're able to specify the color
Available only for Line and Bar. |
|
Automatic Series Column - When checked, the color of each series (data set) is defined automatically by the system
|
Series Column - Columns which date represents a data set
|
|
Series - Data source of the series
Value - Column where the value of the data set is stored
Series Name - Name of the data set
Color - Color of the line/bar of the data set
|
Horizontal Axis Subtitle - Subtitle to be displayed in the horizontal axis. It should clarify the type of data.
If you click on at the right side of this property, you’ll be able to set its value in each Language of the Project. Available only for Line and Bar.
Vertical Axis Subtitle - Subtitle to be displayed in the vertical axis. It should clarify the type of data.
If you click on at the right side of this property, you’ll be able to set its value in each Language of the Project. Available only for Line and Bar.
Minimum Vertical Value - Value where the vertical scale should begin
If you want your scale to start in a different value (usually lower) than the lowest value coming from the database, define it here. Available only for Line and Bar.
Maximum vertical Value - Value where the vertical scale should end
If you want your scale to end in a
different value (usually higher) than the highest value coming from the
database, define it here. Available only for Line and Bar.
|
|
|
| Shortcuts |
|
F2 – Actions
F3 – General properties
|
|
|
|
Updated: 5/6/2016 5:34 PM |
| |
|
|
|


